love a good love-hate relationship, and that’s what I’ve got with technical indicators Technical indicators are those fancy computerized studies that you frequently see at the bottom of price charts that are supposed to tell you what the market is going to do next (as if they really could). The most common studies include MACD, Stochastics, RSI and ADX, just to name a few.
The No.1 (and Only) Reason To Hate Technical Indicators
I often hate technical studies because they divert my attention from what’s most important – PRICE.
Have you ever been to a magic show? Isn’t it amazing how magicians pull rabbits out of hats and make all those things disappear? Of course, the “amazing” is only possible because you’re looking at one hand when you should be watching the other. Magicians succeed at performing their tricks to the extent that they succeed at diverting your attention.
That’s why I hate technical indicators; they dived my attention the same way magicians do Nevertheless, I have found a way to live with them, and I do use them Here’s how: Rather than using technical indicators as a means to gauge momentum or pick tops and bottoms, I use them to identify potential trade setups.
Three Reasons To Learn To Love Technical Indicators
Out of the hundreds of technical indicators I have worked with over the years, my favorite study is MACD (an acronym for Moving Average Convergence-Divergence) MACD, which was developed by Gerald Appel, uses two exponential moving averages (12-period and 26-period). The difference between these two moving averages is the MACD line. The trigger or Signal line is a 9-period exponential moving average of the MACD line (usually seen as 12/26/9…so don’t misinterpret it as a date) Even though the standard settings for MACD are 12/26/9, I like to use 12/25/9 (it’s just me being different). An example of MACD is shown in Figure 10-1 (Coffee).
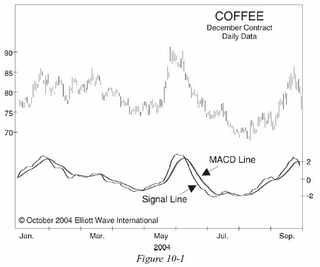
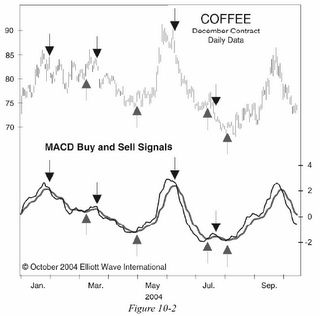
The simplest trading rule for MACD is to buy when the Signal line (the thin line) crosses above the MACD line (the thick line), and sell when the Signal line crosses below the MACD line Some charting systems (like Genesis or CQG) may refer to the Signal line as MACD and the MACD line as MACDA Figure 10-2 (Coffee) highlights the buy-and-sell signals generated Item this very basic interpretation.
Although many people use MACD this way, I choose not to, primarily because MACD is a t rend-following or momentum indicator. An indicator that follows trends in a sideways market (which some say is the state of markets 80% of time) will get you killed For that reason, I like to locus on different information that I’ve observed and named: Hooks, Slingshots and Zero-Line Reversals Once I explain these, you’ll understand why I’ve learned to love technical indicators.
Hooks
A Hook occurs when the Signal line penetrates, or attempts to penetrate, the MACD line and then reverses at the last moment. An example era Hook is illustrated in Figure 10-3 (Coffee).
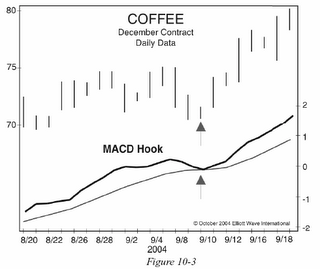
like Hooks because they fit my personality as a trader. As I have mentioned before. I like to buy pullbacks in uptrends and sell bounces in downtrends. And Hooks do just that – they identify countertrend moves within trending markets.
In addition to identifying potential trade setups, you can also use Hooks as confirmation. Rather than entering a position on a cross-over between the Signal line and MACD line, wait for a Hook to occur to provide confirmation that a trend change has indeed occurred Doing so increases your confidence in the signal, because now you have two pieces of information in agreement.
Figure 10-4 (Live Cattle) illustrates exactly what I want this indicator to do: alert me to the possibility of rejoining the trend In Figure 10-5 (Soybeans), I highlight two instances where the Hook technique worked and two where it didn’t.
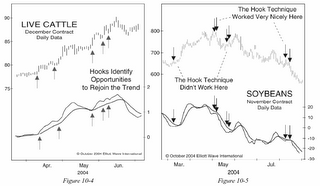
But is it really fair to say that the signal didn’t work? Probably not, because a Hook should really just be a big red flag, saying that the larger trend may be ready to resume. It’s not a trading system that I blindly follow All I’m looking for is a heads-up that the larger trend is possibly resuming. From that point on, I am comfortable making my own trading decisions. If you use it simply as an alert mechanism, it does work 100% of the time.
Slingshots
Another pattern I look for when using MACD is called a Slingshot. To get a mental picture of this indicator pattern, think the opposite of divergence. Divergence occurs when prices move in one direction (up or down) and an indicator based on those prices moves in the opposite direction.
A bullish Slingshot occurs when the current swing low is above a previous swing low (swing lows or highs are simply previous extremes in price), while the corresponding readings in MACD are just the opposite Notice in Figure 10-6 (Sugar) how the May low was above the late March swing low However, in May, the MACD reading tell below the level that occurred in March. This is a bullish Slingshot, which usually identifies a market that is about to make a sizable move to the upside (which Sugar did). 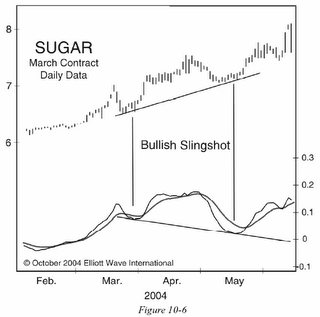
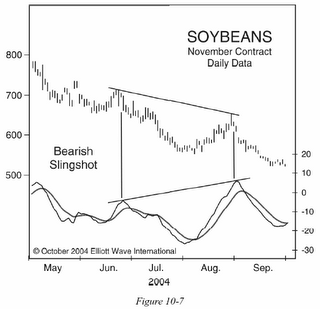
A bearish Slingshot is just the opposite: Prices make a lower swing high than the previous swing high, but the corresponding extreme in MACD is above the previous extreme Figure 10-7 (Soybeans) shows an example era bearish Slingshot.
Zero-Line Reversals
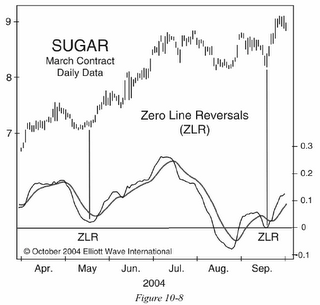
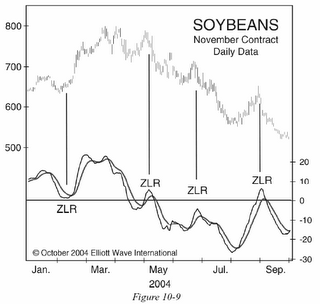
The final trade setup that MACD provides me with is something I call a Zero-Line Reversal (ZLR). A Zero-Line Reversal occurs when either the Signal line or the MACD line Falls (or rallies) to near zero, and then reverses It’s similar in concept to the hook technique described above The difference is that instead of looking for the Signal line to reverse near the MACD line, you’re looking for reversals in either the Signal line or the MACD line near zero. Let’s look at some examples of Zero-Line Reversals and I’m sure you’ll see what I mean. In Figure 10-8 (Sugar), you can see two Zero-Line Reversals Each time, MACD reversed above the zero-line, which means they were both bullish signals When a Zero-Line Reversal occurs from below, it’s bearish. Figure 10-9 (Soybeans) shows an example of one bullish ZLR from above, and three bearish reversals from below. If you recall what happened with Soybeans in September 2005, the bearish ZLR that occurred early that month was part of our bearish Slingshot from Figure 10-7 These combined signals were a great indication that the August advance was merely a correction within the larger sell-off that began in April That meant that lower prices were forthcoming, as forecast in tile August and September issues of Monthly Futures Junctures.
So there you have it, a quick rundown on how I use MACD to alert me to potential trading opportunities (which I love) Rather than using MACD as a mechanical buy-sell system or using it to identify strength or weakness in a market, I use MACD to help me spot trades And the Hook, Sling-shot and Zero-Line Reversal are just a few trade setups that MACD of offers.
Article Source: elliottwave.com
